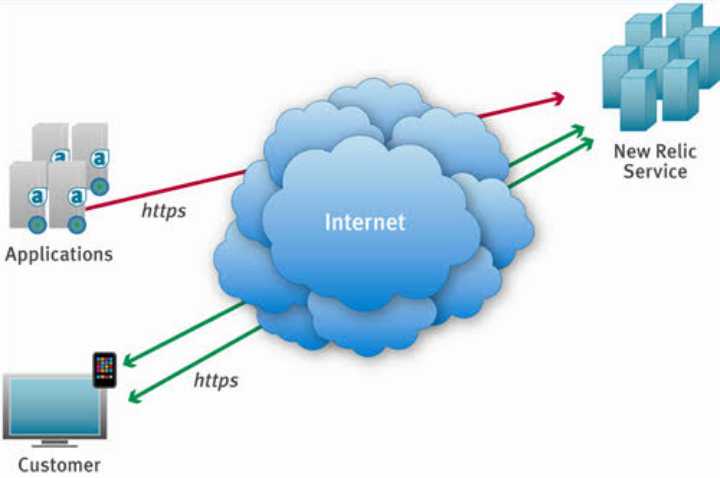
New Relic has emerged as a prominent online software solution, generating considerable buzz for its ability to enhance website performance. This blog post aims to guide you through the intricate world of synthetics monitoring and the invaluable data it unveils, crucial for the seamless operation of your web pages.
Before delving into the mechanics of making synthetics monitoring work seamlessly with New Relic, let's establish a solid foundation by addressing some fundamental questions:
What is New Relic?
New Relic APM stands as a cloud-based application performance management (APM) solution, serving as your steadfast ally in monitoring your applications' performance, tracking their overall health, and prioritizing necessary changes. It vigilantly scans for anomalies within your application's health status. Synthetics, an in-house service, collects this data, which is then analyzed by New Relic APM to gauge your application's well-being, considering factors such as the frequency and severity of these anomalies.
Understanding Synthetic Monitoring
Synthetic monitoring is your predictive crystal ball, foreseeing when a system or service might falter or surpass expectations. It employs centralized services to meticulously monitor performance, scrutinizing everything from low-level events like JVM restarts to application errors.
Synthetics takes on the role of sentinel, continuously transmitting data to our servers and scrutinizing it against historical patterns. These vigilant sentinels can be configured to raise alarms when anything out of the ordinary occurs, such as spikes in memory usage or delays in response times for specific pages within your application, like login pages.
How to Implement Synthetics Monitoring with New Relic
Embark on your journey to harness the power of synthetic monitoring with New Relic by following these essential steps:
1. Selecting a Synthetic Monitor:
An array of monitors awaits your selection, each catering to specific monitoring needs. We highly recommend opting for the Nerd Graph API, providing a standard method for monitoring, including creating, updating, and deleting synthetic monitors via API calls.
Once you've made your choice, add the monitor. Head over to one.newrelic.com, choose the monitor type, and complete the required fields. You can customize additional settings, such as setting periods, adding tags, specifying runtime, and exploring advanced options like SSL verification (for ping and simple browser monitoring), Bypass HEAD request, and Redirect is Failure (for ping). Ensure you select at least three monitoring locations for robust coverage. Upon completion, save your monitor settings.
2. Summary Page:
Monitor your synthetic monitor's status by clicking on its name in the upper-right corner of the summary page. For active incidents triggering alerts, access critical alerts for the selected monitor, or manage policies for all monitors through the "manage policies for all monitors" option.
READ ALSO:-
"HOW TO TURN OFF TOUCH SCREEN ON CHROMEBOOK"
3. Analyzing Monitor Generated Results:
Gain insight into your web app's performance by scrutinizing the results page. Filter and sort the data to identify potential issues or unusual results. Comparing monitor performance across different locations can be illuminating. The "Network timings" graph provides a snapshot of webpage performance over a specific period. To access this data:
- Navigate to New Relic and select Synthetics.
- From the Monitors tab, choose your monitor.
- Click Monitor and then Results.
4. Understanding Resource Load-time:
The synthetic resources page offers an in-depth report, dissecting how each website component impacts overall loading times. This includes images, HTML, CSS, JavaScript, and more. Dive into runtime metrics, resource-specific performance data, and HTTP response codes for each element:
- Navigate to New Relic, then Synthetics.
- From the Monitors dropdown menu, select your monitor.
- Click Monitor, then Resources.


Remember to subscribe